Despite recent challenges, the group travel industry remains resilient, diverse and adaptable, according to new research conducted by The Group Travel Leader.
This summer, we partnered with Bandwagon, a tourism research and public relations firm, to begin our most ambitious study of group travel buying habits to date, asking travel planners more than 20 questions about their group’s travel plans, demographics, price preferences, marketing methods and more.
Preliminary results of this ongoing study came from responses submitted by more than 75 tour operators, travel agents and group leaders throughout the country. Their answers confirm some enduring strengths and reveal some surprising evolutions.
Here are 10 of the most interesting findings from the survey, along with key takeaways that will help travel planners and industry suppliers alike grow their group travel business.
Annual Number of Trips
We asked respondents to indicate the number of day trips and overnight trips they planned in 2019 — the last full year before the pandemic — and the number of day trips and overnight trips they planned for 2021.
Main Findings: In 2019, respondents planned an average of 29 overnight trips. That number dropped to nine overnight trips for 2021. In addition, respondents planned an average of 21 day trips in 2019. That number dropped to 12 in 2021.
Key Takeaway: Before the pandemic, our readers were doing an impressive amount of business, with overnight trips slightly outpacing day trips. And though the number of trips they planned dropped precipitously through the pandemic, group travel is making its way back, with our average respondent planning a total of 20 trips this year.
Traveler Demographics
We asked respondents to indicate the percentage of their travelers that fell in various age ranges, beginning at under 21 and increasing in increments of 10 years.
Main Findings: Respondents indicated that 31% of their travelers are in the 70-79 age range, followed closely by 30% in the 60-69 age range. An additional 14% fall in the 50-59 age range. For each age range below 50 years and above 80 years, respondents indicated single-digit percentages of travelers.
Key Takeaway: It’s no surprise that group travel is most popular in the 10 to 15 years after retirement, a period in which many Americans today remain active and healthy. But it’s also worth noting that 32% of group travelers had not yet turned 60. This suggests a potential growth opportunity for travel planners to begin courting new customers in the 50-59 age range. Travelers who encounter and enjoy group travel while they are still working are likely to become frequent customers in the years after they retire.

Trip Length
We asked respondents to indicate the average length of their overnight trips, ranging from one night to 15 or more nights, for both 2019 and 2021.
Main Findings: Respondents showed a strong preference for shorter trips. In 2019, 20% said their average trip length is two nights; that dropped to 19% for 2021. Three-night trips dropped from 12% in 2019 to 11% in 2021. Four-night trips dropped from 13% to 9%, and five-night trips dropped from 15% to 13%. The share of seven-to-eight-night trips dropped from 18% to 15%. The share of groups not operating overnight trips grew from 5% in 2019 to 12% in 2021.
Key Takeaway: The trend toward shorter trips, which has been developing for years, continues to hold, with trips under a week proving most popular. And while a small minority of travel planners have suspended overnight trips altogether, the majority who are still operating them haven’t deviated from their pre-pandemic trip lengths. These average durations likely reflect domestic trips, as international tours often last seven to 10 days or longer.
Trip Pricing
We asked respondents to indicate the average retail price they charged for domestic day trips, domestic overnight trips and international trips in both 2019 and 2021.
Main Findings: The average overnight domestic trip price in 2019 was $1,284. That dropped 12% to $1,135 for 2021. The average international trip price in 2019 was $1,834, dropping 13% to $1,592 for 2021. The average prices for domestic day trips for both 2019 and 2021 was $92.
Key Takeaway: Pricing for overnight and international trips fell 12-13%. On these trips, where tour operators have some profit margins and pricing flexibility, discounts might reflect efforts to encourage customers to return to travel after the pandemic. The reduced prices may also reflect a redirection to closer international destinations, as European and Asian borders were largely closed to American travelers.

Lodging Type
We asked respondents to indicate the types of lodging they include in their tours. They were given a list of eight categories and were able to choose multiple selections from the list.
Main Findings: The most popular hotel category was national full-service chains such as Hilton or Marriott, which are used by 79% of travel planners. Next came national limited-service chains such as Hampton Inn or Fairfield Inn at 64%, followed by resorts at 56% and local full-service hotels at 51%. Only 12% of respondents reported using budget chains such as Days Inn or Red Roof Inn.
Key Takeaway: Contrary to conventional wisdom, group leaders seem willing to use nicer properties, including full-service hotels and resorts. Limited-service chains will always be a mainstay of the group market, but price is not the only factor planners care about. Hotel sales professionals may have an opportunity to sell more upscale product to groups than they previously thought.
Modes of Transportation
We asked respondents to indicate the percentage of their trips in 2019 and in 2021 that included flights.
Main Findings: Respondents said that in 2019, 32% of their trips included flights and 68% were drive-only. For 2021, those percentages changed slightly, to 31% and 69%, respectively.
Key Takeaway: Though the motorcoach is fundamental to group travel, industry observers shouldn’t make the mistake of assuming that groups don’t fly. Nearly a third of our respondents’ trips include air travel, which allows them to visit faraway destinations while still keeping trip lengths short.
Driving Distance
We asked respondents to indicate the average distance from home that their groups travel on drive-only trips, with options beginning at 200 miles or less and increasing in 200-mile increments.
Main Findings: A sizable minority — 39% — said their average drive trip is 200 miles or less. Another 27% said the average trip is 201 to 400 miles, followed by 401 to 600 miles at 13% and 601 to 800 miles at 12%. Only 10% of respondents reported traveling any distance greater than 800 miles from home.
Key Takeaway: When groups travel over the road, they don’t want to spend a lot of time on the motorcoach. The most popular answer, 200 miles or less, suggests that many groups aren’t willing to drive more than three hours from home, and few are willing to travel more than 10 hours on a motorcoach. The days of long, rambling coach trips are over.
Supplier Price Points
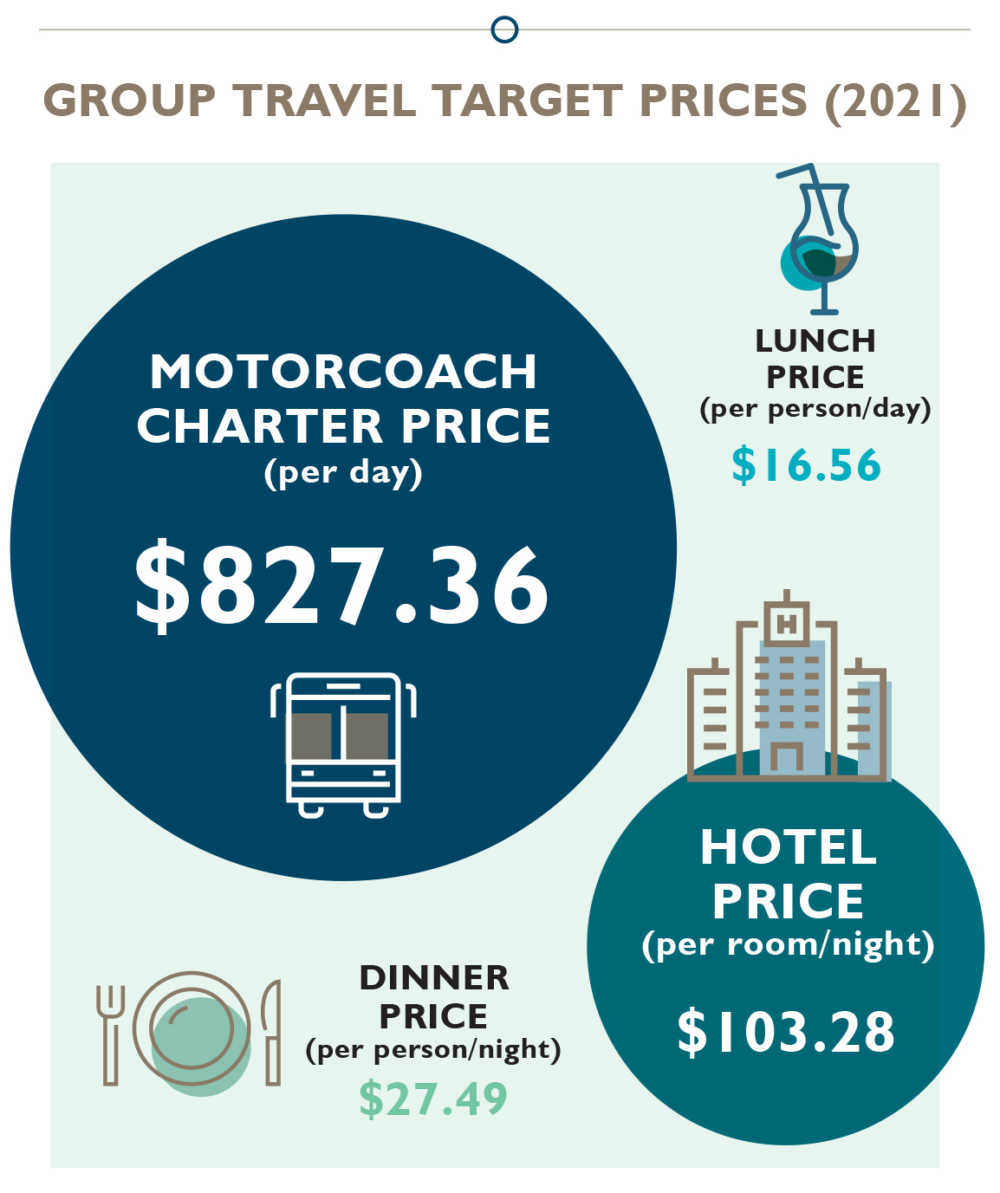
We asked respondents to indicate the target price points they seek for motorcoach charter per day, hotels per room/night, lunches per person and dinners per person. They provided answers for 2019 and 2021.
Main Findings: The average target price for motorcoach charter in 2019 was $769 per day, rising 8% to $827 in 2021. Target hotel prices rose slightly, from $100 in 2019 to $103 in 2019. Lunch prices rose from $15 to $17, and dinner prices rose from $26 to $28.
Key Takeaway: Recent events, including the pandemic, the general labor shortage and a long-term shortage of motorcoach drivers, are putting upward pressure on supplier pricing. These increases are also consistent with consumer price inflation documented throughout this year.
Lead Times
We asked respondents to indicate how far in advance of departure they begin planning trips and begin marketing trips. They provided answers for 2019 and 2021.
Main Findings: In 2019, planners began organizing trips about 267 days — almost nine months — before departure. For 2021, that number decreased by 9% to 244 days. In 2021, they began marketing trips 207 days — seven months — before departure, down 3% from 2019.
Key Takeaway: Many industry professionals have reported lead times decreasing in recent years, and these findings bear that out. Destination marketers should use this information strategically to begin reaching out to travel planners about a year in advance of their desired travel dates.
Marketing Methods
We asked respondents to indicate what methods and media they use to market trips. They were given a list of nine options and were able to choose multiple selections from the list.
Main Findings: The most popular marketing method was word-of-mouth, with 88% reporting that they rely upon it. Next was email or e-newsletters at 83%, followed by group presentations at 61%, social media at 60% and phone calls at 57%. Only 12% reported mailing physical catalogs, and only 9% are using paid online advertising.
Key Takeaway: As always, the tourism business runs on relationships. Word-of-mouth is still the leading marketing method, which means that good reputation remains crucial for travel planners. But planners are growing increasingly adept at marketing through digital channels as well.


